Pothole Detection Simulation
In [8]:
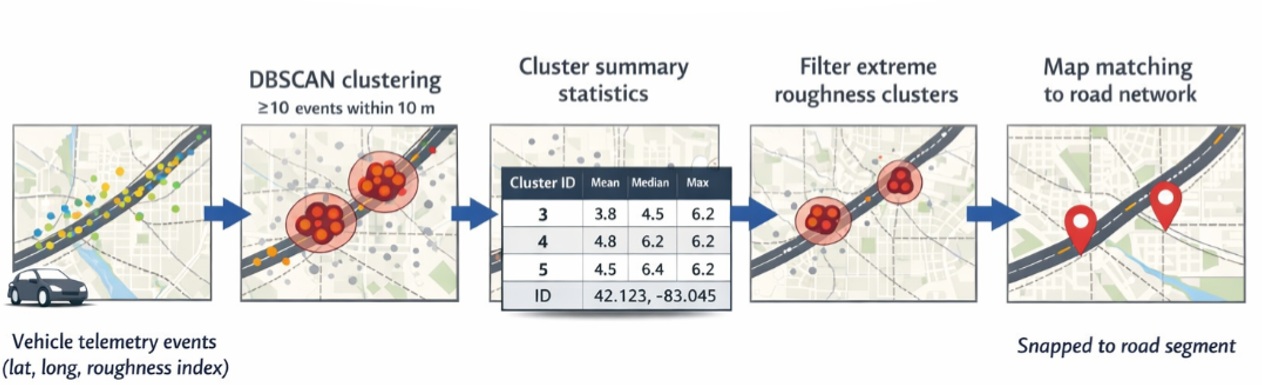
# Pothole Cluster Detection Simulation with DBSCAN
# Author: Yassir-style prototype

import numpy as np
import pandas as pd
import matplotlib.pyplot as plt
from sklearn.cluster import DBSCAN
from sklearn.preprocessing import StandardScaler

# -----------------------------
# 1️⃣ Generate simulated vehicle data
# -----------------------------
def generate_vehicle_data(n_points=2000, n_potholes=4, city_center=(42.3314, -83.0458),
                          lat_spread=0.05, lon_spread=0.08, random_state=42):
    np.random.seed(random_state)

    # Base street distribution
    latitudes = city_center[0] + np.random.uniform(-lat_spread, lat_spread, n_points)
    longitudes = city_center[1] + np.random.uniform(-lon_spread, lon_spread, n_points)

    # Normal road conditions
    iri = np.random.normal(1.5, 0.3, n_points)          # International Roughness Index
    wheel_slip = np.random.normal(0.02, 0.01, n_points) # Normal wheel slip
    speed = np.random.normal(35, 5, n_points)           # Vehicle speed (mph)

    # Inject potholes
    pothole_centers = []
    for i in range(n_potholes):
        center_lat = city_center[0] + np.random.uniform(-lat_spread, lat_spread)
        center_lon = city_center[1] + np.random.uniform(-lon_spread, lon_spread)
        pothole_centers.append((center_lat, center_lon))

        # Assign random points to this pothole
        idx = np.random.choice(range(n_points), size=int(n_points*0.05), replace=False)
        latitudes[idx] = center_lat + np.random.normal(0, 0.001, len(idx))
        longitudes[idx] = center_lon + np.random.normal(0, 0.001, len(idx))
        iri[idx] = np.random.normal(4.5, 0.7, len(idx))
        wheel_slip[idx] = np.random.normal(0.12, 0.03, len(idx))
        speed[idx] = np.random.normal(18, 3, len(idx))

    df = pd.DataFrame({
        "latitude": latitudes,
        "longitude": longitudes,
        "iri": iri,
        "wheel_slip": wheel_slip,
        "speed": speed
    })

    return df, pothole_centers

# -----------------------------
# 2️⃣ DBSCAN clustering to detect potholes
# -----------------------------
def detect_potholes(df, eps=0.6, min_samples=20):
    features = df[["latitude", "longitude", "iri", "wheel_slip", "speed"]]
    scaler = StandardScaler()
    X_scaled = scaler.fit_transform(features)

    db = DBSCAN(eps=eps, min_samples=min_samples)
    df["cluster"] = db.fit_predict(X_scaled)

    return df

# -----------------------------
# 3️⃣ Estimate pothole severity
# -----------------------------
def estimate_severity(df):
    clusters = df[df["cluster"] != -1].groupby("cluster").agg({
        "latitude": "mean",
        "longitude": "mean",
        "iri": "mean",
        "wheel_slip": "mean",
        "speed": "mean",
        "cluster": "count"
    }).rename(columns={"cluster": "n_points"}).reset_index()

    clusters["severity_score"] = (
        clusters["iri"]*0.5 +
        clusters["wheel_slip"]*5 +
        (40 - clusters["speed"])*0.2
    )

    return clusters

# -----------------------------
# 4️⃣ Run simulation
# -----------------------------
df, true_centers = generate_vehicle_data()
df_clustered = detect_potholes(df)
severity_df = estimate_severity(df_clustered)

print("Detected Pothole Clusters:")
severity_df.head(10)

# -----------------------------
# 5️⃣ Visualization
# -----------------------------
# plt.figure(figsize=(10,6))
# plt.scatter(df_clustered["longitude"], df_clustered["latitude"],
#             c=df_clustered["cluster"], cmap="tab10", s=15)
# plt.title("Pothole Cluster Detection with DBSCAN")
# plt.xlabel("Longitude")
# plt.ylabel("Latitude")
# plt.show()
Detected Pothole Clusters:
Out[8]:
| cluster | latitude | longitude | iri | wheel_slip | speed | n_points | severity_score | |
|---|---|---|---|---|---|---|---|---|
| 0 | 0 | 42.331292 | -83.045791 | 1.493765 | 0.019285 | 35.267299 | 1434 | 1.789849 |
| 1 | 1 | 42.340917 | -83.100228 | 4.528992 | 0.119044 | 17.762733 | 58 | 7.307168 |
| 2 | 2 | 42.307043 | -83.110333 | 4.518389 | 0.122719 | 18.426519 | 42 | 7.187488 |
| 3 | 3 | 42.316837 | -83.071748 | 4.240866 | 0.116535 | 18.057337 | 46 | 7.091639 |
| 4 | 4 | 42.345228 | -83.019673 | 4.357173 | 0.121590 | 18.173651 | 46 | 7.151804 |
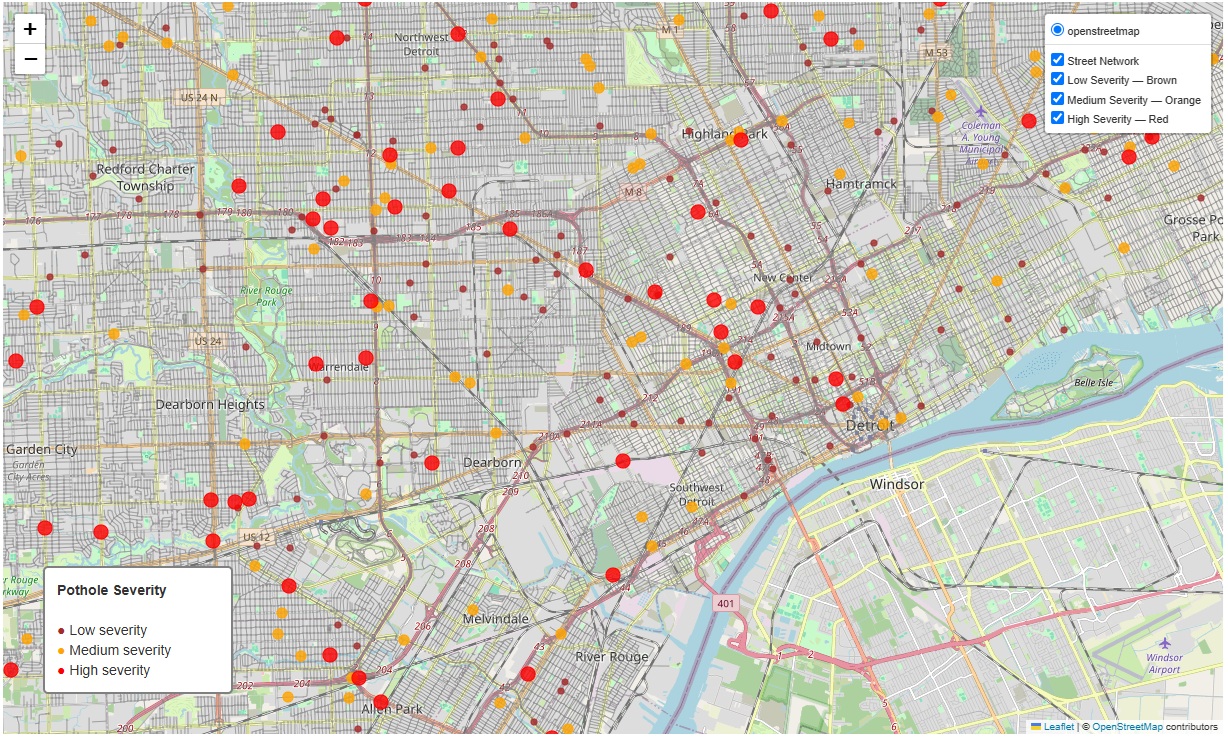
Pothole Visualization
In [ ]: